In metal AM, “root-cause analysis” often sounds more scientific than it feels. When a part fails CT, when tensile results scatter, when surface roughness trends upward, teams don’t immediately analyse the process. They first try to reconstruct the story of the part looking at which powder was used, what the parameter set was, what changed in post-processing, whether the machine had a warning event, whether a shift ran the job differently.
That reconstruction phase is where time disappears, and where mistakes creep in. Not because people are careless, but because the evidence chain is fragmented across systems and files.
This matters for operations because it creates a vicious loop. Investigations take too long, so teams compensate with more inspection and more conservatism. Scrap and rework remain stubborn because the process isn’t stabilised, instead it’s being policed.
Below are three practical scenarios that show what “root-cause without data chaos” looks like when AM quality data is connected and queryable, and why SPC and structured analytics are the difference between constant firefighting and predictable production.
Scenario 1. CT rejects cluster after a powder refresh
What you see. A build passes visual checks, but CT rejects increase. It’s not catastrophic, it’s a cluster. Two builds out of five show higher porosity.
The spreadsheet reality. Powder batch numbers are recorded, but mixing ratios are inconsistent. Refresh was done, but the details live in an operator note. CT reports are PDFs in a folder. You spend days piecing together which parts had which powder state.
What a structured approach looks like. You start with the failing parts and pull their linked genealogy (powder lot(s), reuse state, refresh ratio, and the build job they came from). You immediately see that the CT rejects share a common condition such as a specific refresh event, or a powder lot mix that was used only on those builds.
Now you can test hypotheses quickly:
- Did the powder state shift outside your CTQ limits (flowability proxy, oxygen trend, PSD drift)?
- Was the refresh ratio applied consistently?
- Did sieving state differ (sieved vs unsieved) compared to your baseline?
- The value isn’t “finding a culprit.”
The value is narrowing the search to a small set of plausible contributors within minutes, not days, and capturing that evidence so the next refresh event becomes controlled, not feared.
Scenario 2. Mechanical scatter grows across one machine
What you see. Tensile results are still within spec, but scatter is increasing. Ops feels it as rework rises, and yield confidence drops. The temptation is to tighten inspection and hope.
The spreadsheet reality. Test results are recorded, but linking them to parameter sets and machine events is manual. Machine alarms and maintenance logs are separate. You can’t easily tell whether this is normal variation or drift.
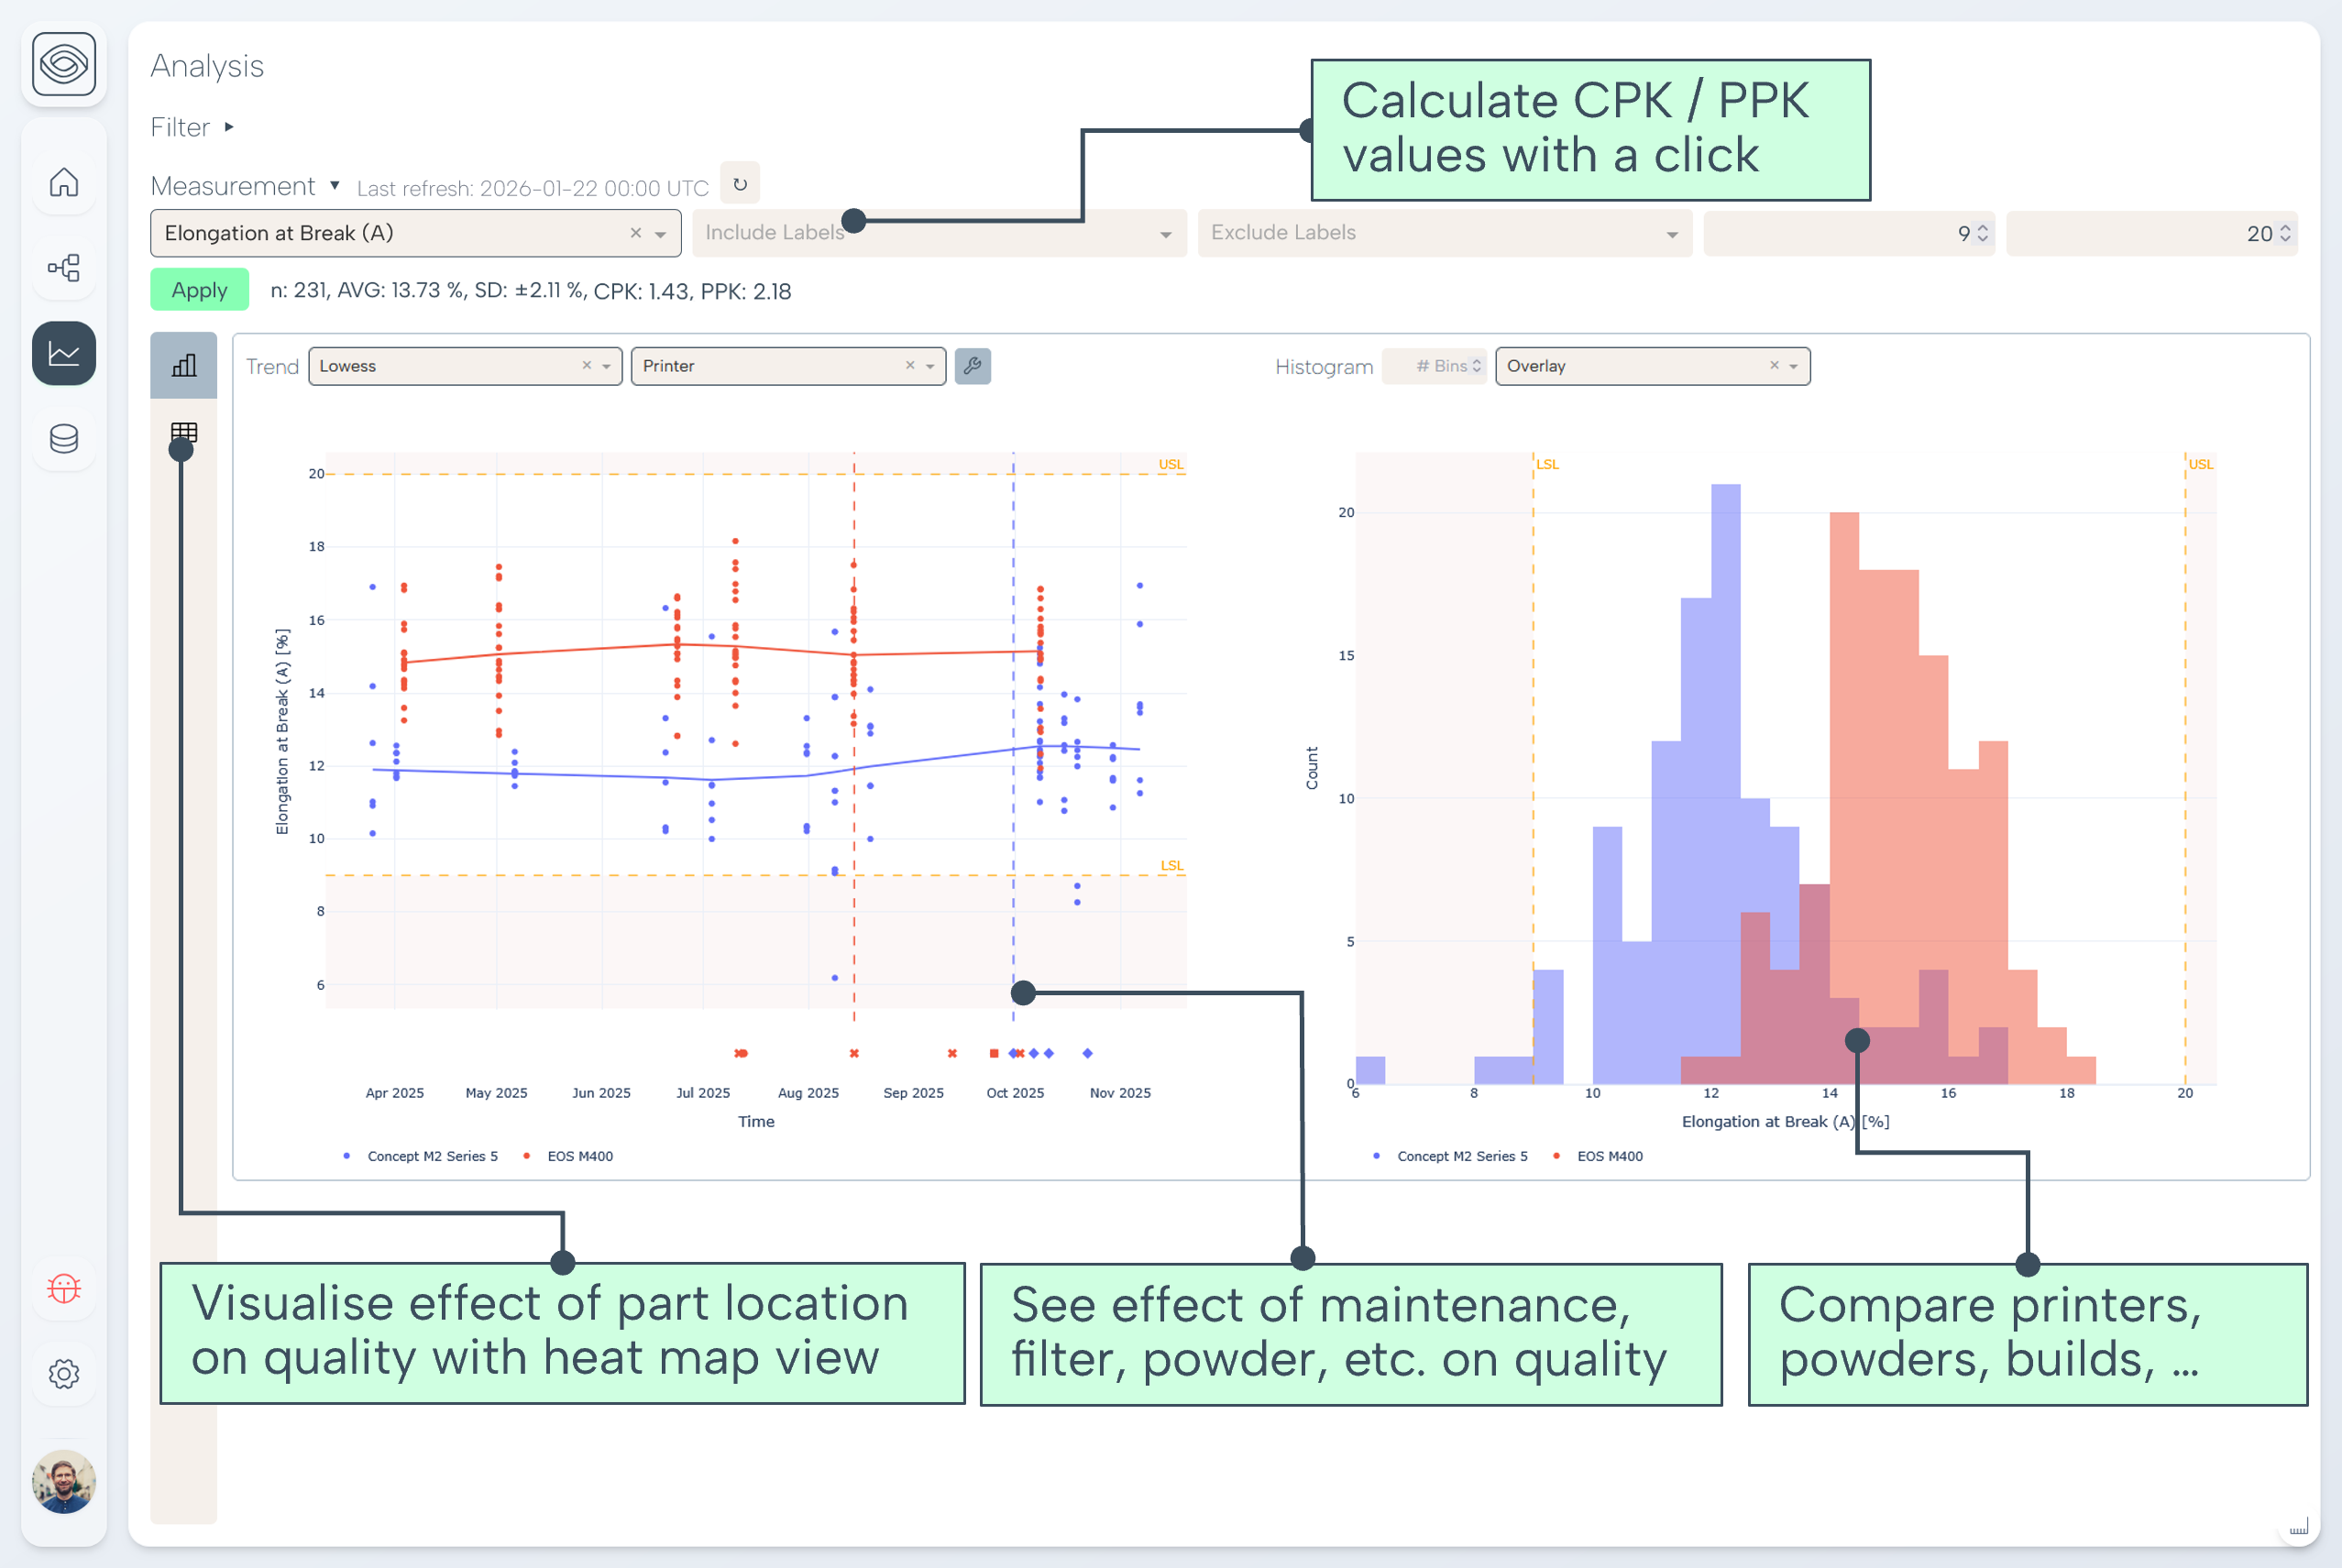
What a structured approach looks like. This is where SPC earns its keep. You trend a CTQ indicator (density proxy, key mechanical property, dimensional metric) over time, by machine. The chart shows a gradual drift on one machine, widening variance before outright failure.
Now root-cause analysis becomes disciplined:
- Was there a parameter update?
- Did the machine show a pattern of warning events?
- Was the powder state different on this machine’s jobs compared to the fleet?
- Did post-processing route change?
Because the data is connected, these are queries, not meetings. And because SPC flagged drift early, your corrective action can be small and controlled, not a scramble after a major scrap event.
Scenario 3. A non-conformity appears after post-processing
What you see. Parts print fine, but fail after heat treatment or finishing. The instinct is to blame post-processing, but the real story is often interaction between powder state + build parameters + post-process route.
The spreadsheet reality. Post-processing certificates are archived, but they are not linked to part genealogy. Investigation becomes “who remembers which batch went where?”
What a structured approach looks like. You compare “good” and “bad” parts with the same nominal design, then interrogate what differed across the chain. Often the difference is not a single event but a combination such as a powder reuse state paired with a borderline parameter set, amplified by a particular heat treatment route.
This is precisely the kind of insight that is almost impossible to generate reliably from disconnected files, and exactly why production AM needs a digital quality backbone rather than spreadsheet glue.
What Ops should take from this
Good root-cause analysis shouldn’t depend on brilliant individuals pulling all-nighters. It should be built into how the operation is set up. If your organisation is always asking “what changed?”, the issue is rarely that people aren’t smart enough. It’s that the evidence chain is not designed to answer the question quickly.
The operational goal is not to get better at investigations. It’s to reduce the number of investigations because drift is detected early and the process is stabilised. That’s why the improvement loop matters:
- Traceability links the chain at part level.
- SPC makes drift visible early.
- Root-cause workflows use linked data to narrow causes fast.
- Actions are verified by trending back into control.
Summary
If spreadsheets are your primary way of finding evidence, your ‘investigation’ is mostly archaeology, not control, and this won’t allow scale. Connected data, practical SPC, and repeatable analytics are how metal AM becomes less dramatic and more industrial. For operations leaders, that’s the real prize, fewer surprises, less scrap, and a production line that behaves predictably.
Related articles
.png)
Blog Post
Architecting an Additive Manufacturing Software Stack
amsight doesn’t replace your MES or ERP - it fills the critical gap between them by owning the AM-specific quality evidence chain, so you stop assembling audit packs from spreadsheets and start proving part-level traceability, SPC, and process stability from powder to final inspection.
Aug 31, 2026
.png)
Let's Talk About Your AM Production
Book a call and we'll discuss your process, requirements as we share our findings and walk through why we built amsight.