.png)
Powder-bed AM doesn’t usually fail loudly. It fails quietly. A build completes. Parts look fine. The report gets filed. Then CT starts flagging porosity more often. Surface roughness trends upward. Dimensional scatter widens. Mechanical results start skating closer to the limit. Eventually, you scrap a build and call it “one of those weeks”.
That’s the expensive illusion, that scrap is random.
In production, scrap is rarely random. It’s often the end of a drift story you could have seen earlier if you had the right indicators and the discipline to trend them. This is where Statistical Process Control (SPC) stops being a classroom concept and becomes an operations tool.
From pass/fail to drift detection
Many AM teams are still optimised for proving that a part passed. That’s necessary, especially in regulated supply chains. But it’s not sufficient for stable yield.
Pass/fail tells you what happened to this part. Drift detection tells you what is happening to your process over time (across machines, batches and weeks). Operations leaders care about the second one because it’s how you reduce scrap and rework sustainably.
The good news? You don’t need a PhD in statistics to run useful SPC. You need a pragmatic playbook.
1) Start with CTQs that actually predict scrap
The most common SPC mistake is trying to trend everything. Powder-bed AM generates too much data for that approach. Instead, start with a small set of Critical-to-Quality (CTQ) indicators that you know are linked to scrap or rework in your environment. For example, choose one from each category:
- Material outcome: a density/porosity proxy (CT or coupon)
- Geometry outcome: deviation in a known sensitive feature
- Surface outcome: roughness in a critical interface region
You can add more later. The key is consistency and repeatability. If the CTQ can’t be measured routinely, it can’t be controlled.
2) Trend across time (and across machines), not just parts
SPC is about time. If you only look at one build, you’re doing forensics. Trend CTQs across multiple builds and multiple machines. This is where early warning lives, a gradual widening of variation, a slow movement of the mean, or the early clustering of rejects.
This is also where traceability starts paying operational dividends. When CTQs are linked to powder state, parameter sets, machine events, and post-processing routes, you can move quickly from “we saw drift” to “we know what changed.”
3) Set control limits that trigger action
Control limits shouldn’t be theoretical. They should be operational. You’re not trying to produce a perfect model. You’re trying to answer a practical question, “when should we intervene before parts go out of spec?”
Keep it simple. Use control rules that teams can remember and trust. For example:
- Trend rules: repeated movement in one direction triggers review
- Variance rules: widening scatter triggers containment before failure
- Capability rules: a CTQ approaching the edge of process capability triggers escalation
The best control limits are the ones people actually act on, not the ones that look best in a presentation.
4) Build “quality gates” so response becomes repeatable
In many operations, response to drift is improvisation such as a meeting, a parameter tweak, an extra CT scan “just to be safe”. Then work continues without knowing if it helped. Quality gates make response repeatable. They define — in advance — who owns the alert, what the first checks are, and what actions are allowed (and which require approval). Most importantly, they force a verification step. Did the action bring the process back into control?
That’s how SPC becomes a scrap-reduction engine rather than a chart.
5) Close the loop with root-cause analysis (not guesswork)
SPC tells you that drift is happening. Root-cause analysis tells you why. This is where AM teams lose time, not because they lack expertise, but because data is fragmented, powder records in one place, build logs in another, inspection results elsewhere, post-processing notes in email.
Connected data turns root cause into a workflow. Identify the CTQ that drifted, correlate it against likely contributors (powder state, parameter changes, machine events, post-process route), validate with targeted checks, implement corrective action, and then use SPC to confirm the process returns to control.
.png)
Where software helps
For Operations leaders, the barrier to practical SPC isn’t motivation, it’s time and complexity. Teams don’t have the bandwidth to manually extract, clean, and reconcile data every week just to update charts.
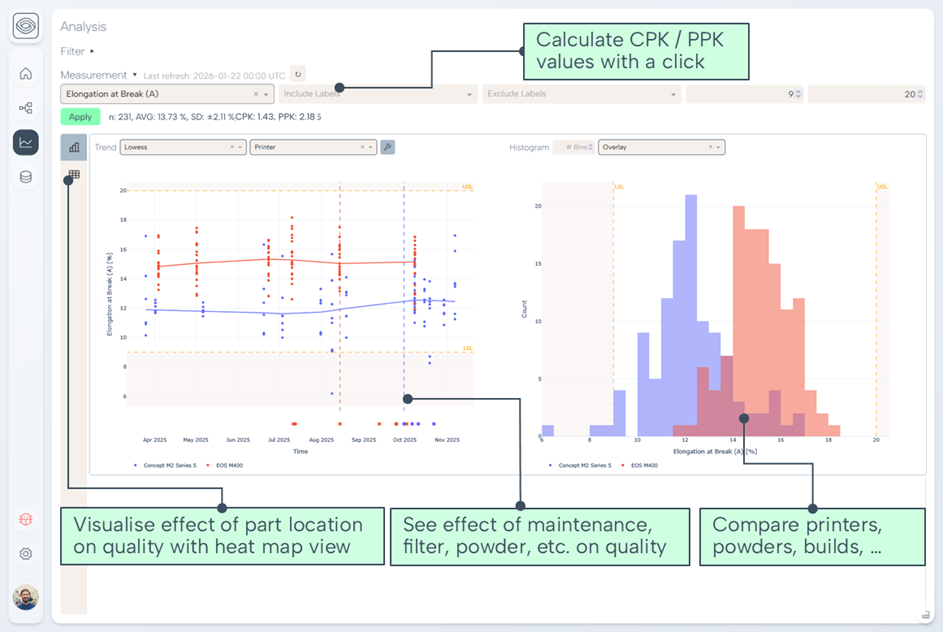
That’s where a software like amsight helps because it structures and links the data so SPC becomes a routine operating discipline rather than a recurring Excel project. Production Monitoring lets you monitor the production and identify trends early, while Process & Machine Qualification ties stability evidence into qualification workflows and keeps it consistent over time.
Want to learn more about SPC in AM?
Register for our Webinar ‘Statistical Process Control in AM – From Data to Process Stability and Repeatable Part Quality’ on May 13th 2026 here.
A final thought for production leaders
If your quality strategy is mostly “inspect and explain”, you are optimising for the past.
Production winners optimise for the next build — early warning, repeatable response, and verified improvement. Powder-bed AM can absolutely be run like a mature production technology, but it requires a shift from pass/fail thinking to drift thinking, and the discipline of SPC built on data that’s connected enough to act on.
That’s how you stop paying for surprises.
Related articles
.png)
Blog Post
Process-Centred vs Part-Centred Thinking in Regulated Additive Manufacturing
Regulated AM customers are not only asking whether a part conforms. They want to know whether the process behind it is stable, repeatable and controlled. This article explains why mature AM suppliers need both a part passport and a process passport.
Jul 28, 2026
.png)
.png)
Blog Post
Structuring Powder, Process and Inspection Data: Requirements for an AM-Specific QMS
When AM moves into production, quality data becomes a relationship problem. This article shows why powder, machine, process and inspection evidence must be structured together, not stored as disconnected documents.
Jul 16, 2026
Let's Talk About Your AM Production
Book a call and we'll discuss your process, requirements as we share our findings and walk through why we built amsight.