.png)
There’s a moment every production AM team hits. It doesn’t show up in your first prototypes, and it’s not solved by buying a better printer. It arrives quietly, then becomes unavoidable - the spreadsheet tipping point.
At the start, spreadsheets feel like freedom. You can track anything, any way you like. A tab for build logs. Another for powder batches. A folder of inspection PDFs. A shared drive for CT images. It’s quick. It’s familiar. It feels “good enough.”
Then volume increases. More machines. More materials. More revisions. More customer reporting. More audits. And suddenly, quality work becomes less about engineering and more about administration.
The real issue isn't Excel - it's the lack of a data model
In production, quality isn’t just a set of files. It’s a relationship network:
- this powder blend → used in these builds
- this build job → produced these parts
- these parts → followed this post-process route
- this route → produced these quality outcomes
Spreadsheets don’t enforce relationships. They assume them. That’s the difference between “we have data” and “we have evidence.”
When you scale, four failure modes appear:
- The “duplicate truth” problem. The same fact exists in multiple places: a powder lot in one sheet, a build record in another, an inspection report named slightly differently in a folder. People reconcile discrepancies manually. That’s fine at the beginning, but catastrophic at scale.
- The “context collapse” problem. A number on a spreadsheet isn’t an explanation. A CT fail doesn’t just mean “bad part.” It means “bad part in this powder state, under these parameters, after this heat treatment.” When context is scattered, root-cause analysis becomes a treasure hunt rather than a workflow.
- The “non-linear workload” problem. Add one machine and you don’t add “a bit” of quality overhead, you add a multiplication of combinations: machines × materials × parameter sets × post-processing routes × reporting requirements. The workload scales with people and machines.
- The “audit archaeology” problem. Most teams can produce an audit pack. The question is how they produce it. If “prove conformity” means rebuilding a bespoke report from multiple sources every time, you’re not audit-ready - you’re audit-capable with effort. That distinction matters in regulated supply chains where customers expect consistency, not heroics.
Why "better spreadsheets" doesn't fix it
The usual response is discipline, stricter templates, naming conventions, locked folders, macros. It helps. But it can’t solve the core limitation. Excel is not designed to be the system of record for production quality. It doesn’t know what a build job is. Or a part genealogy. Or a powder reuse cycle. Or a post-processing chain. Those concepts live in people’s heads, and the spreadsheet is just the patchwork.
What "Centralising AM Data" actually means
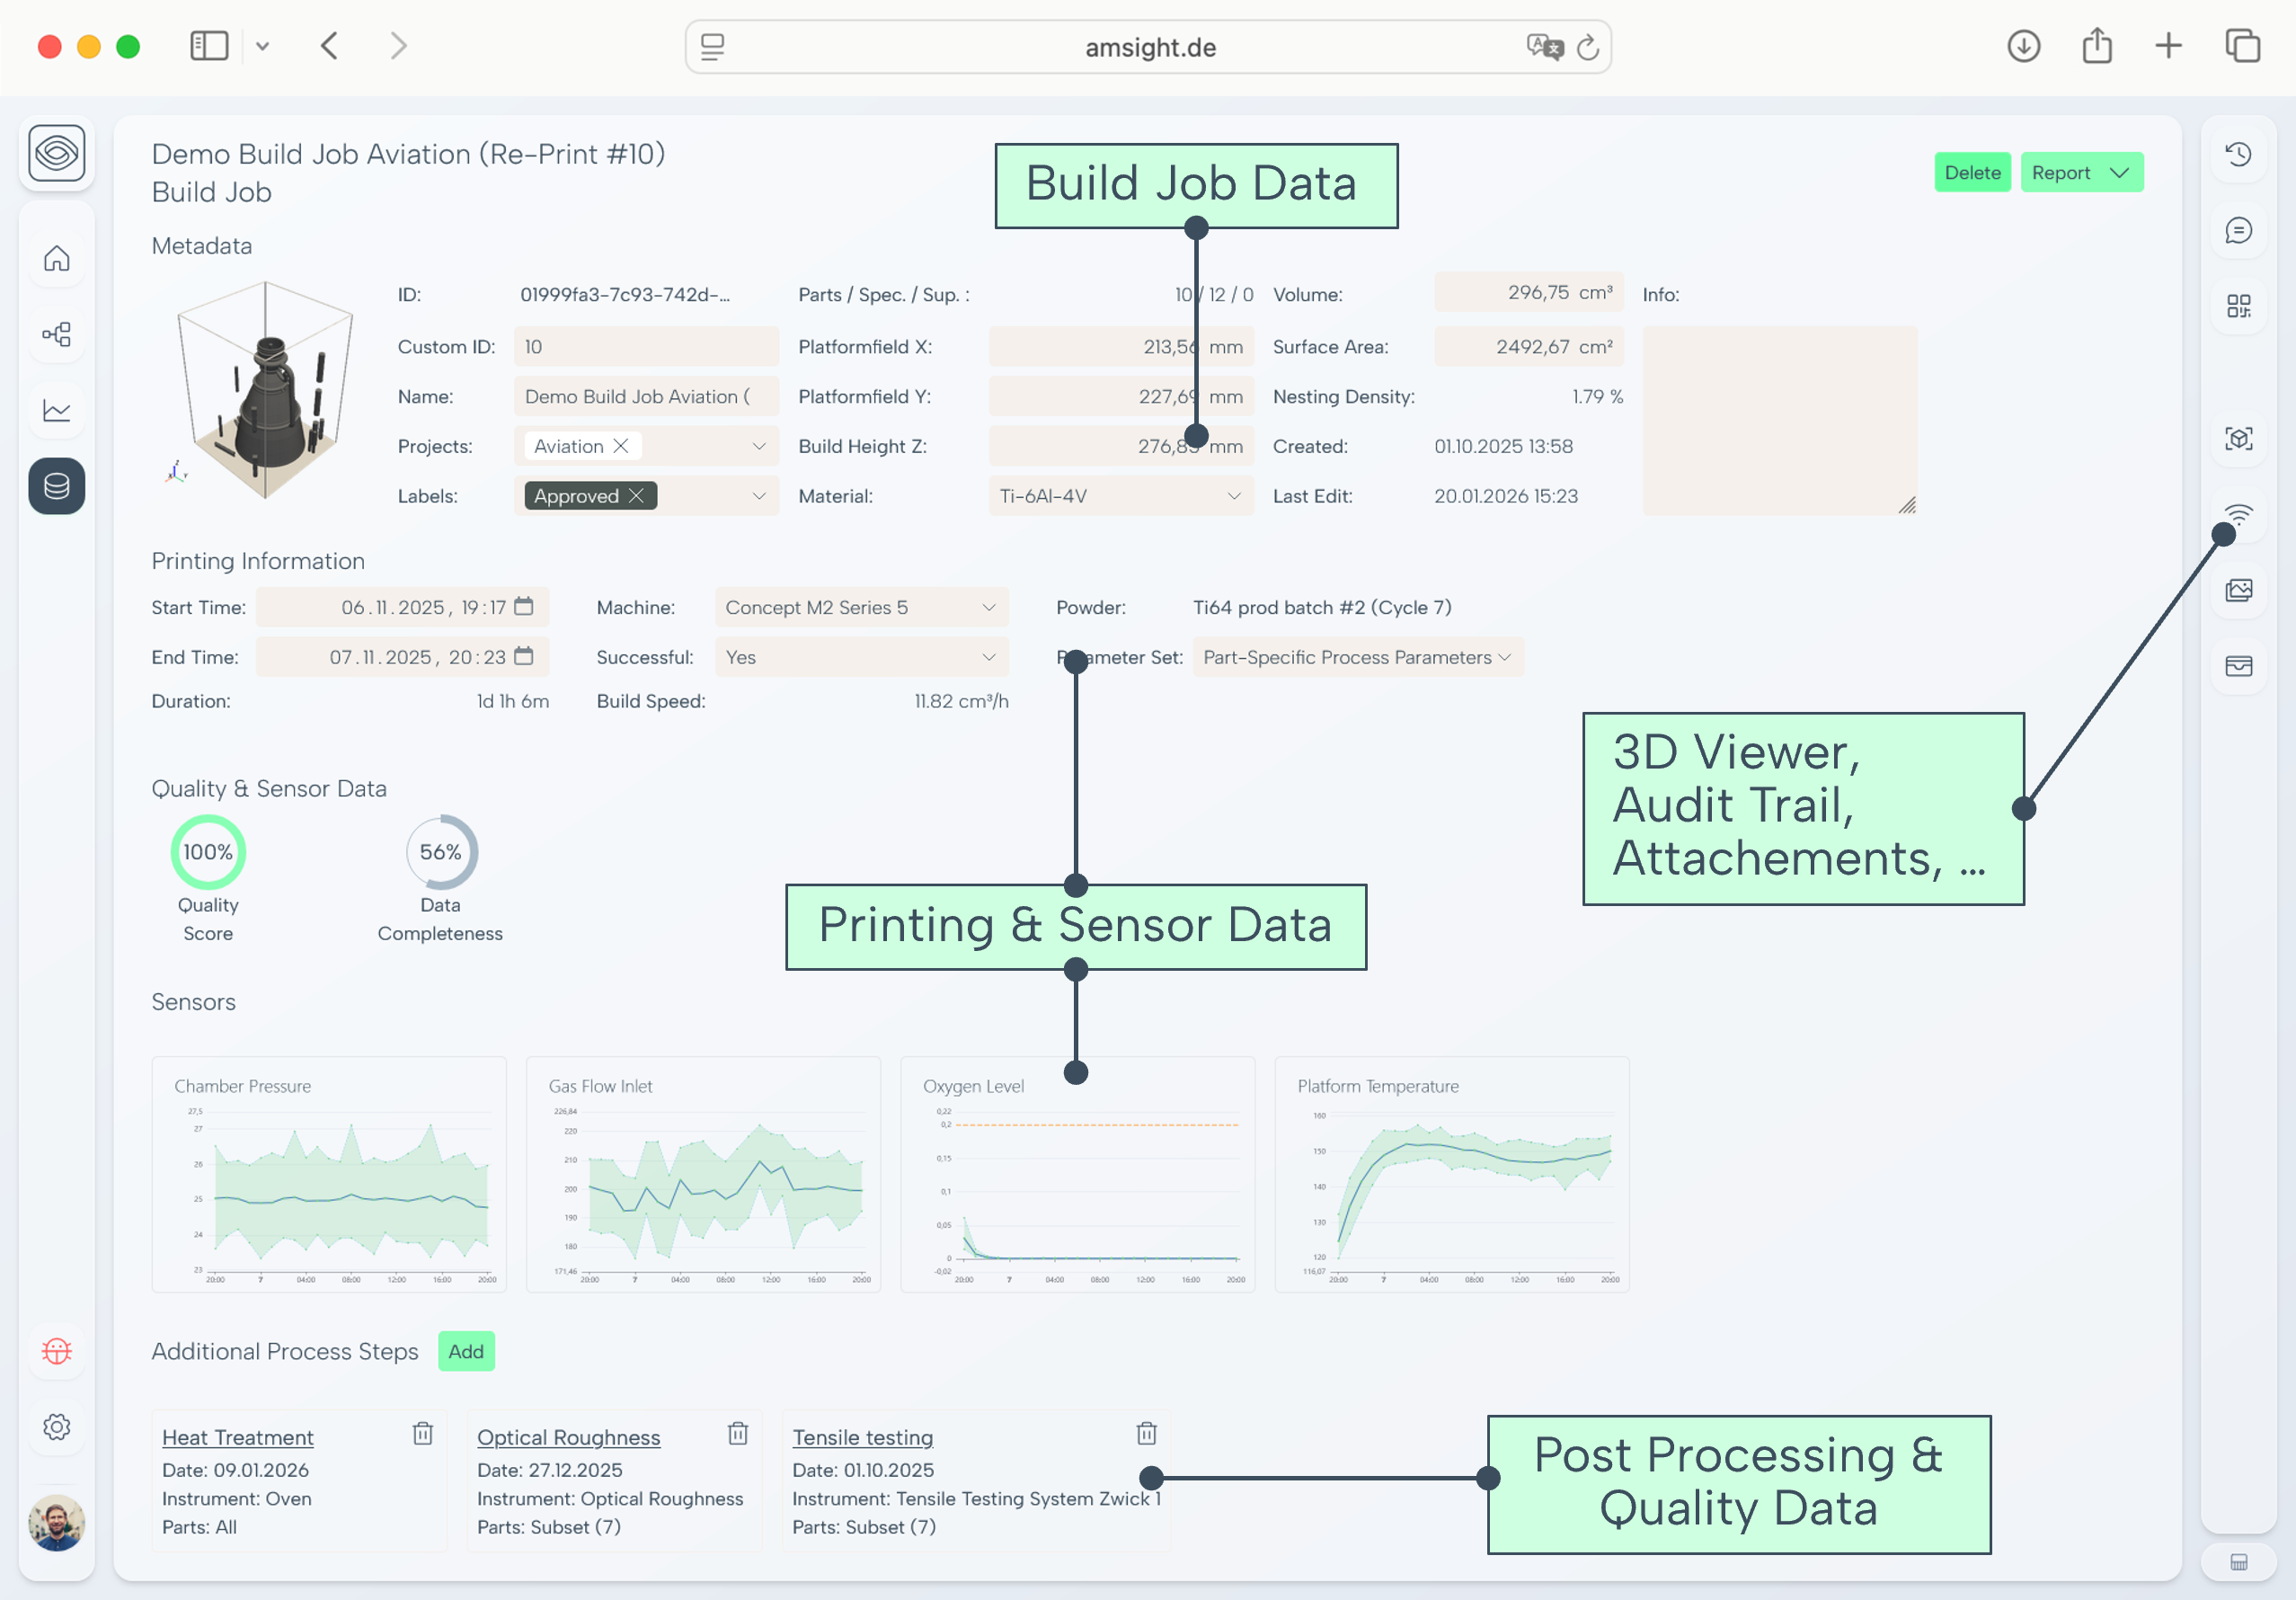
Centralising doesn’t mean creating one giant folder. It means creating a digital quality backbone. In other words a structured environment where powder, process, post-processing, and inspection data are linked at part level and can be queried, analysed and reported consistently.
So basically, quality evidence becomes a by-product of the process, not a separate manual project.
At amsight, that’s the philosophy behind production monitoring and reporting workflows, capture structured data across the chain, visualise stability (including SPC), and generate repeatable reports without rebuilding them in Excel every week. It’s not about replacing ERP or MES. It’s about giving QA and production teams a layer that’s purpose-built for AM quality evidence.
A practical "scale test" you can run today
Pick one shipped part and try to answer these questions within 5 minutes:
- What powder touched it and what was the state of the powder (mixes, reuse cycles)?
- What parameters and machine state applied to the build?
- What post-processing route did it follow?
- Where is the inspection evidence?
- What changed compared to the last accepted build?
If that’s hard, you’ve found the tipping point. The next step isn’t more spreadsheets. It’s a backbone.
Summary
If your AM quality system is a collection of spreadsheets, you don’t have a quality system, you have a coping mechanism. And coping mechanisms don’t scale.
The good news is that centralising AM data isn’t a multi-year IT overhaul. It can start with one product family, one cell, one pain point (reporting, traceability, powder genealogy). But the direction matters, toward a digital quality backbone where quality becomes repeatable, auditable and scalable, because the data is finally connected.
Related articles
.png)
Blog Post
Process-Centred vs Part-Centred Thinking in Regulated Additive Manufacturing
Regulated AM customers are not only asking whether a part conforms. They want to know whether the process behind it is stable, repeatable and controlled. This article explains why mature AM suppliers need both a part passport and a process passport.
Jul 28, 2026
.png)
.png)
Blog Post
Structuring Powder, Process and Inspection Data: Requirements for an AM-Specific QMS
When AM moves into production, quality data becomes a relationship problem. This article shows why powder, machine, process and inspection evidence must be structured together, not stored as disconnected documents.
Jul 16, 2026
Let's Talk About Your AM Production
Book a call and we'll discuss your process, requirements as we share our findings and walk through why we built amsight.