In metal additive manufacturing, “traceability” has become a badge of seriousness. We can trace powder batches. We can trace build jobs. We can trace post-processing steps. We can trace inspection results. Great.
Now ask the question that matters to operations, “why are we still scrapping parts?” The uncomfortable answer is that traceability, on its own, is a rear-view mirror. It helps you explain yesterday. It doesn’t stop tomorrow.
Traceability is evidence. Stability is control.
Traceability tells you what was used, when, and where. That’s vital for audits and customer confidence. But scrap and rework are driven by variation, and variation is a production problem. If you want scrap to fall, you need to understand what influences quality, detect drift early, quantify stability, and intervene before defects harden into parts.
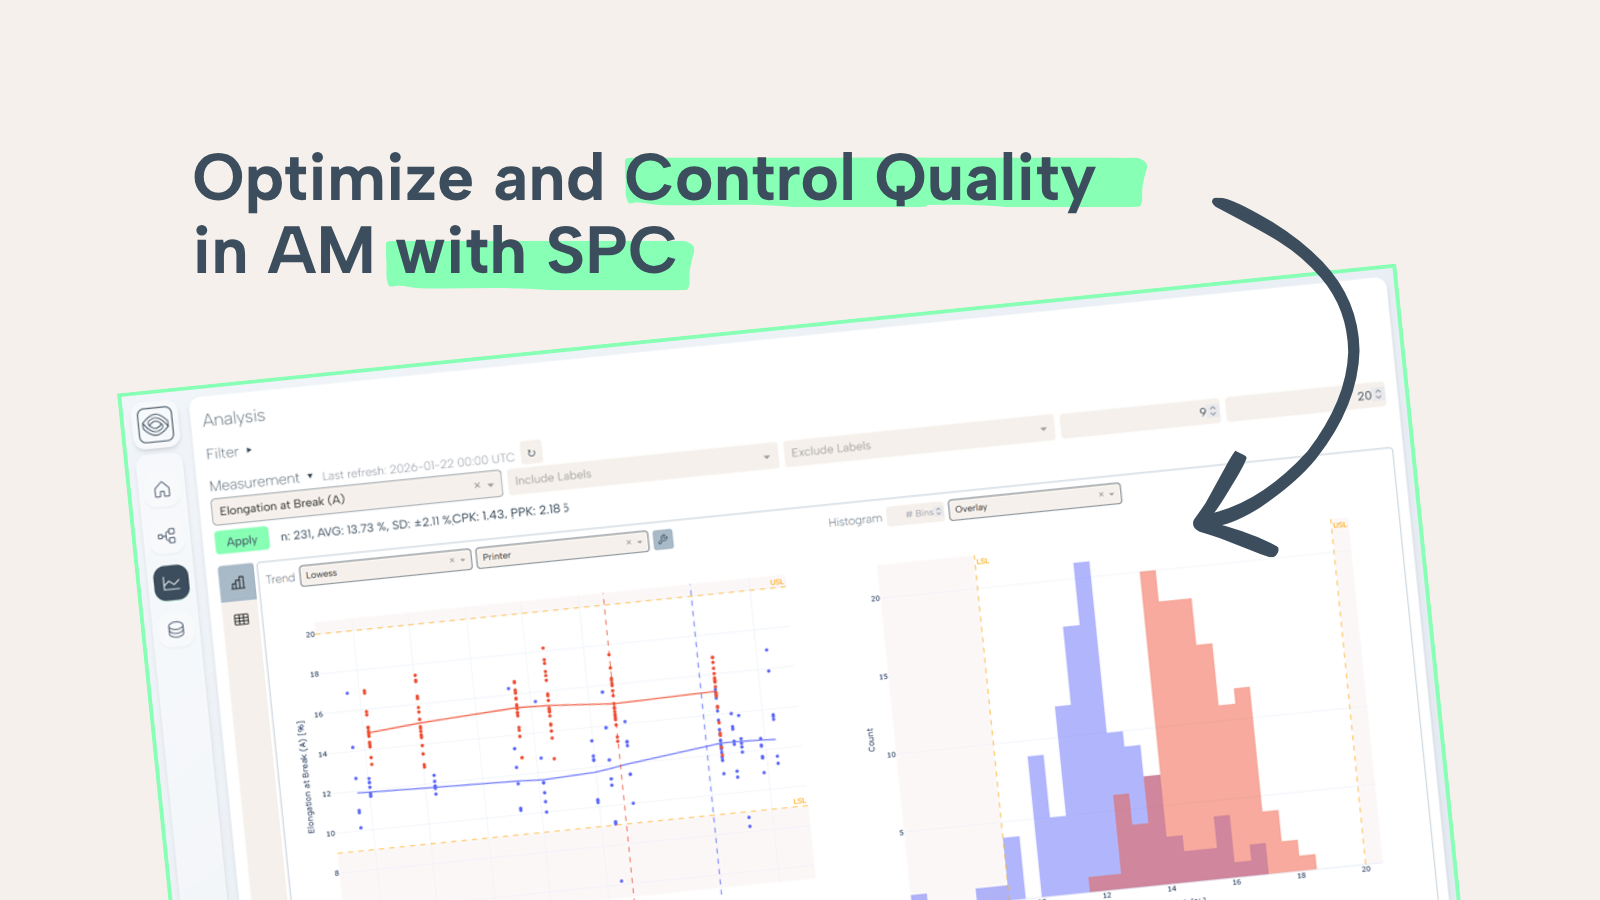
That’s exactly what Statistical Process Control (SPC) is for. It’s not glamorous, which is why it’s powerful. It turns a complex process into a controllable one.
Why SPC Is Hard in AM (Until You Connect The Data)
Most AM teams “know” SPC matters. What stops them is practicality.
The problem? The data required for SPC is split across machine logs, powder records, post-processing notes, inspection systems, and spreadsheets. Even if you create a control chart once, keeping it updated and consistent across machines and product families becomes a job in itself.
So teams default to what they can do, inspect more, CT more, test more. Scrap remains stubborn because the process isn’t being stabilised, it’s being policed.
The Improvement Loop: Traceability + SPC + Quality Gates + Action
A mature AM production loop looks like this:
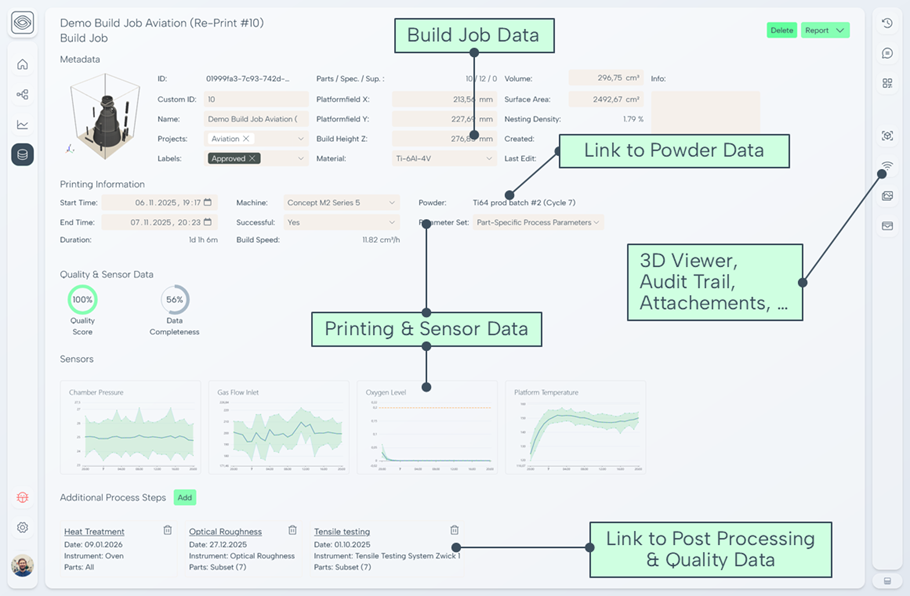
- Traceability links powder → process → post-processing → inspection at part level.
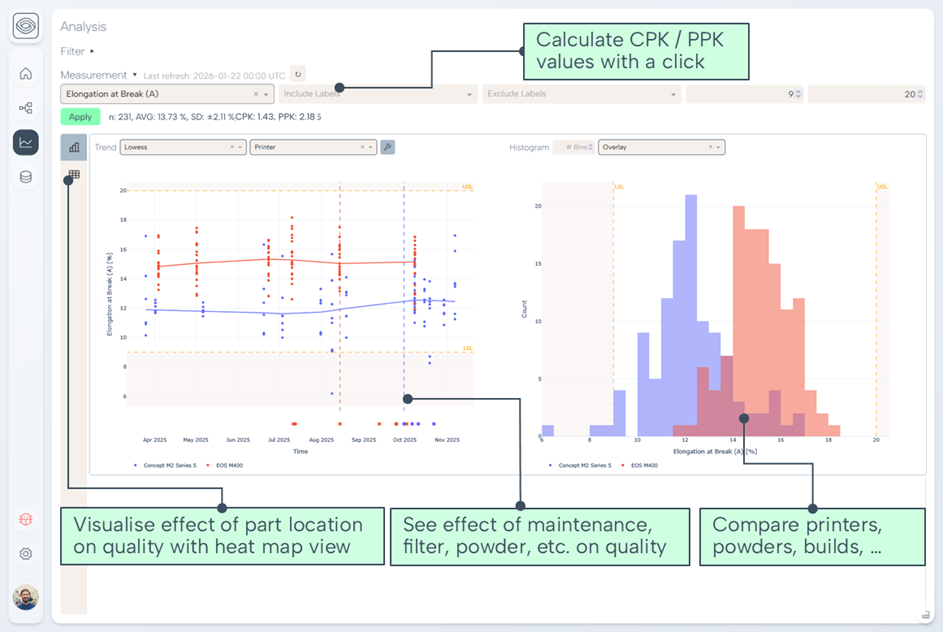
- SPC lets you analyse the data to understand quality influences and root-causes for quality drifts.
- Quality gates are implemented and monitored to detect drift and growing variability.
- Actions are defined to continuously improve the production.
This is where traceability stops being a compliance asset and becomes an operations asset.
What This Looks Like in Practice
With a software like amsight, the heavy lift is in structuring and linking the data so it’s usable:
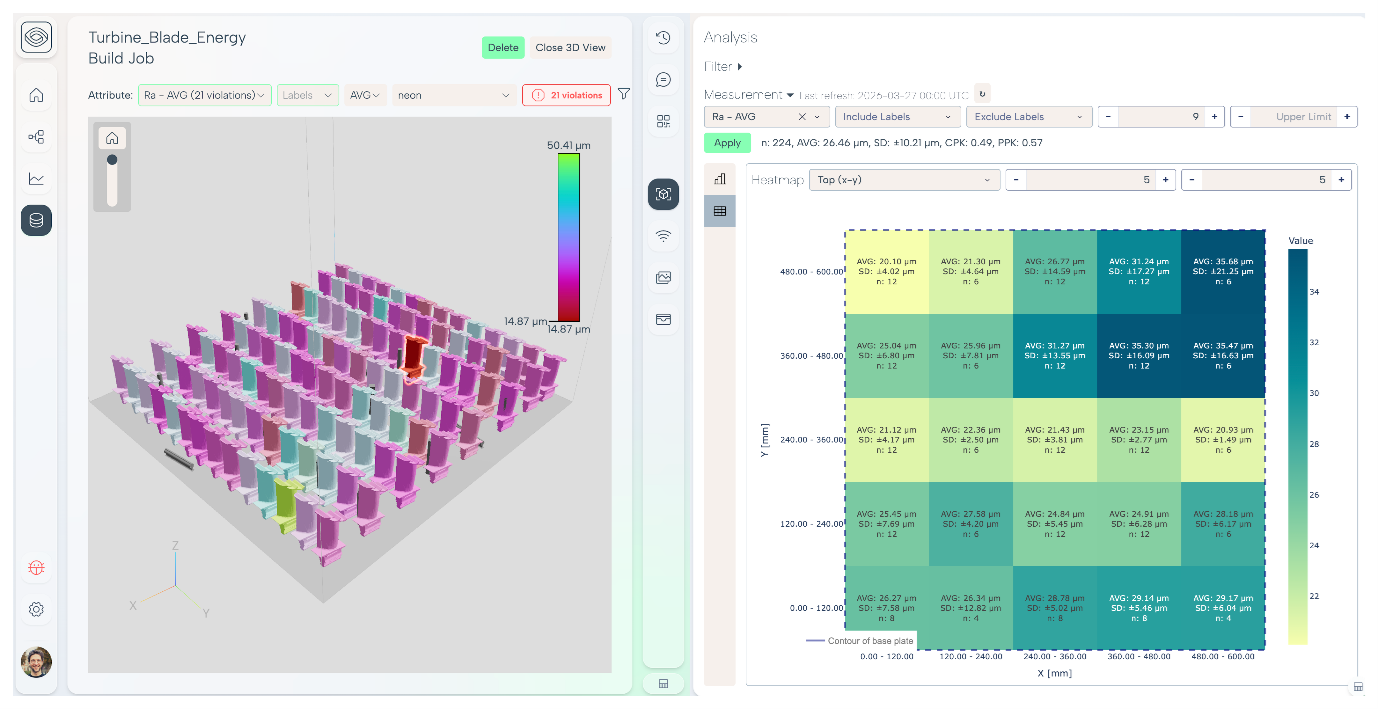
- Dashboards show stability, variation, and trends across builds.
- Reports are repeatable (no more rebuilding analyses in Excel for each customer review).
- When a deviation appears, you can move quickly from “this part failed” to “this combination of factors is drifting”.
That’s why amsight’s Build-in analytics and SPC sits at the centre of the production story: it’s the bridge between “we have the data” and “we can improve the process”.
So What?
If your AM quality system is built mainly around traceability and end-of-line inspection, you are optimising for explanation, not prevention.
Scrap reduction happens when you treat AM like the production technology it is becoming. Connect the data, put SPC on top, and make improvement a repeatable loop, not a heroic investigation.
Want to learn more about SPC in AM?
Register for our Webinar ‘Statistical Process Control in AM – From Data to Process Stability and Repeatable Part Quality’ on May 13th 2026 here.
Related articles
.png)
Blog Post
Building a Feedback Loop Between Inspection, Process Parameters, and Powder Management
AM quality data should do more than prove compliance, it should improve production. This insight shows how closing the loop between inspection, process context and powder history helps teams detect drift earlier, reduce rework and build more stable AM processes.
Jun 23, 2026
.png)
Blog Post
Positioning AM Quality Software in Your Existing IT Landscape
The problem with industrial AM isn’t ambition, it’s architecture. This insight explains why forcing AM quality evidence into MES, QMS or spreadsheets creates chaos, and how amsight gives IT teams a cleaner way to make powder-to-part traceability repeatable.
Jun 16, 2026
.png)
Podcast
Additive Insight releases new podcast episode with amsight - unpacking what 'quality management' really means for production
If you’re trying to scale AM from “we can make it” to we can prove it (every time), the latest episode of the Additive Insight podcast is well worth a listen.
Jun 11, 2026
Let's Talk About Your AM Production
Book a call and we'll discuss your process, requirements as we share our findings and walk through why we built amsight.